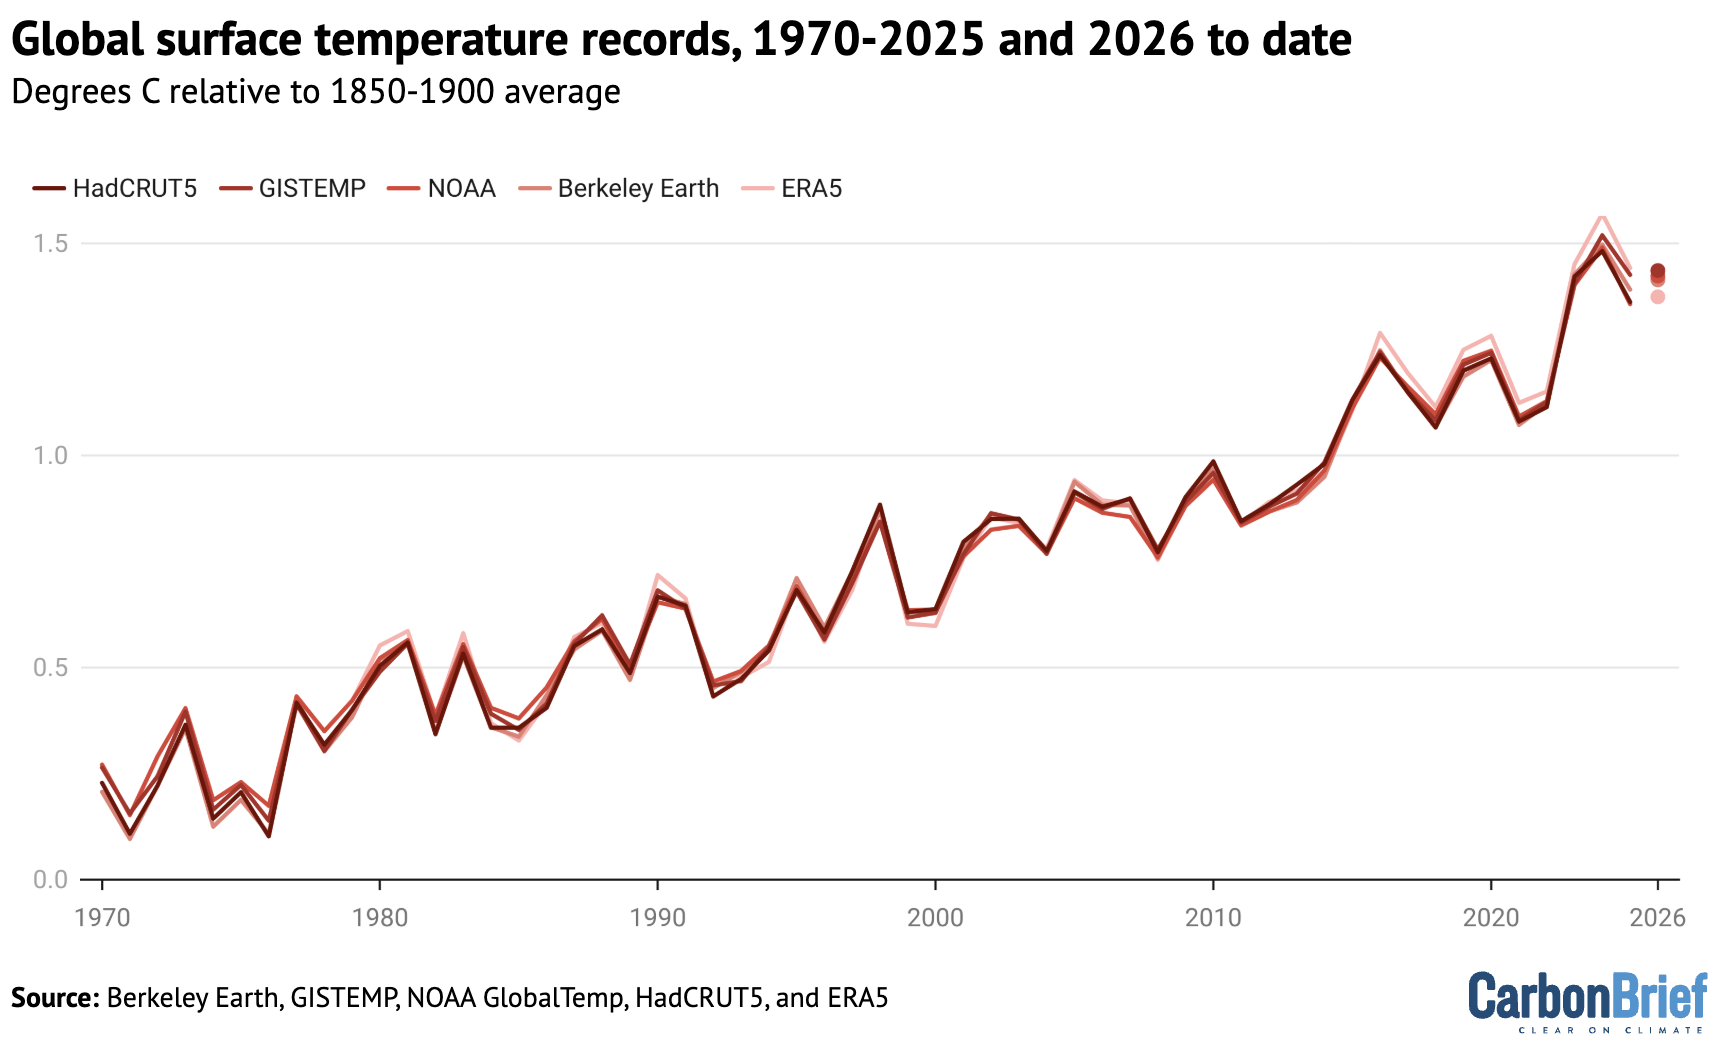
The first quarter of 2026 began under the cooling influence of a weak La Niña, yet it still registered as the fourth-warmest start to a year on record. That a La Niña period — typically associated with below-average global surface temperatures — could produce such readings underscores how far the baseline of planetary warmth has shifted. According to an analysis of five major global temperature datasets by Carbon Brief, the planet is on a trajectory to make 2026 the second-warmest year since records began, with a narrow but significant probability of it ranking even higher.
The primary driver of this anticipated shift is the projected emergence of a strong — and perhaps "super" — El Niño event by early autumn. El Niño, the warm phase of the El Niño-Southern Oscillation (ENSO), is a cyclical pattern in the tropical Pacific that redistributes vast quantities of heat from the ocean to the atmosphere, reshaping weather systems across continents and reliably pushing global surface temperatures upward. While 2026 currently carries a 19% chance of surpassing 2024 as the hottest year ever recorded, the deeper concern among climate scientists is the momentum a sustained El Niño would create heading into 2027.
The mechanics of compounding heat
ENSO's influence on the global temperature record operates with a well-documented lag. The peak warming effect of an El Niño event tends to register not during the event itself but in the months that follow, as the redistributed oceanic heat works its way through the climate system. This is why the strongest El Niño years often serve as prologues to record-setting successors. The 2015–2016 El Niño, one of the most powerful in the modern record, contributed to 2016 holding the title of hottest year for nearly a decade. A similar dynamic played out more recently: the El Niño that developed in 2023 helped propel 2024 to the top of the rankings.
If the current trajectory holds and a strong El Niño materializes by autumn, the pattern would repeat. A sustained warm phase in late 2026 would almost certainly position 2027 to set a new historical peak. The question is not whether El Niño amplifies warming — that mechanism is well established — but how large the amplification will be atop a baseline that is already elevated by long-term greenhouse gas accumulation.
This distinction matters. Each ENSO cycle now operates on a higher thermal floor than the last. The cooling phases offer less relief; the warming phases push further into uncharted territory. The result is a ratchet effect in which temporary natural variability no longer obscures the underlying trend but instead accentuates it.
Signals beyond the thermometer
Beyond surface temperatures, the environmental indicators of a warming system are becoming increasingly difficult to dismiss as noise. Arctic sea ice reached a winter peak this year that tied with 2025 for the lowest maximum extent in the satellite record, which dates to the late 1970s. A winter maximum is supposed to represent the Arctic's annual recovery — the point at which ice coverage is at its most extensive. When even that high-water mark sets record lows, it signals that the system's capacity to regenerate is diminishing.
The convergence of record-low ice and rising thermal energy suggests that the brief reprieve offered by La Niña was a masking effect on a much deeper, more persistent trend. Ocean heat content, which accounts for the vast majority of the energy trapped by greenhouse gases, has been climbing steadily and does not reset with ENSO cycles. The oceans absorb heat on timescales far longer than the atmosphere releases it, meaning the thermal inertia of the system is growing regardless of whether any given year features El Niño or La Niña conditions.
What emerges from the data is a picture in which natural variability still matters — it determines whether a given year ranks second or first — but the range within which that variability operates has shifted decisively upward. The question facing policymakers and the public is no longer whether records will continue to fall, but how quickly the intervals between them are shrinking, and what that compression implies for adaptation timelines that were designed around a more gradual curve.
With reporting from Carbon Brief.
Source · Carbon Brief